WAFERMAP and PANELMAP application notes
We would like to give you information on special applications, which are possible with the functionality of WAFERMAP and PANELMAP. Additionally, we would like to encourage you to let us know special applications you are doing with WAFERMAP and PANELMAP. In this case, we could publish a joint Application Note, if you are interested. Also, in case you would like to use our products for a special application and are not sure how to do it, please contact us.
Click here to visit our website for these Application notes
Application Note 1: Metrology Self Test
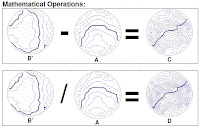
Application Note 2: Difference and Ratio of Wafer Maps
Application Note 3: Editing Wafer Maps from Metrology Tools
Application Note 4: Visualizing Tool "Fingerprints"
Application Note 5: Temperature Mapping Using Multiple Thermocouples
Application Note 6: Simulation of Wafer Rotation
Product presentations WAFERMAP and PANELMAP
New presentations available for WAFERMAP and PANELMAP from Boin website. Selfrunning presentations highlight newest features and applications.
You will find:
-WAFERMAP Product Presentation at http://www.boin-gmbh.com/download/WAFERMAP.pps
-PANELMAP Product Presentation at http://www.boin-gmbh.com/download/PANELMAP.pps
You will find:
-WAFERMAP Product Presentation at http://www.boin-gmbh.com/download/WAFERMAP.pps
-PANELMAP Product Presentation at http://www.boin-gmbh.com/download/PANELMAP.pps
WAFERMAP Features - what can you do with this metrology software?
The most important features of WAFERMAP for Windows are listed below:
- Input of up to 32768 values and according site coordinates
- Import functions for data from metrology tools
- such as Filmetrics or Eichhorn and Hausmann E+H,
- which directly write the WAFERMAP format (e.g. ISIS Optronics), and
-which write pure ASCII data
- Export of pictures in different formats
- Export of the analysis of complete data sets into HTML format
- Configurable 1D- (line scan), 2D- (Contour and colored), 3D (solid or wire frame), 3D bar chart, and 2D value plots
- Statistical analysis (Histogram, calculation of mean, Standard Deviation, etc.)
- Sigma range maps
- File compare operations (add, subtract, multiply, divide, or average) of two different maps
- Global operations (add, subtract, divide, square, square root, etc.)
- 1st and 2nd derivative of a map
- Shift (X and Y direction) and rotation of grids
- Mirroring of maps
- Automatic generation of circular patterns (9, 25, 49, 81, 121, 169, 225, up to 1521 sites)
- Automatic generation of Cartesian patterns based on X and Y resolution
- Definition of any site pattern using a graphic editor
- Cut and Paste functionality for coordinates and measurement values e.g. from Excel
- Statistical Process Control tools including:
- Trend charts sortable by any criterion (date & time, mean, max, min, std. dev., etc.)
- X-Y-Plots of trend parameters
- Trend Lists sortable by any criterion (date & time, mean, max, min, std. dev., etc.)
- Browser
- Global Statistics ("All points, all measurements")
- Inter-application communication via DCOM (ActiveX server)
- Multiple files can be loaded and open simultaneously
- Multiple views of a single file can be selected and displayed simultaneously
- Multiple views can be printed in b/w or color on a single sheet, printouts are configurable
- Extensive on-line help and HTML based user manual.
Click here to visit Boin GmbH and to download demo software versions
Editors’ Choice Best Product Award in 1999
In developing a product that is truly making a difference in semiconductor manufacturing, Boin GmbH received the prestigious Editors’ Choice Best Product Award, presented annually by Semiconductor International magazine, for its metrology software WAFERMAP. Semiconductor International announced 20 winners whose products are making a difference in semiconductor manufacturing.
Click here to visit Boin GmbH and to download demo software versions
What is Wafermap?
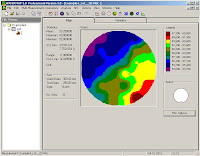
WAFERMAP is an award winning, scientific software package used to collect, edit, analyze and visualize measured physical parameters on semiconductor wafers. WAFERMAP can import data files from various metrology tools such as ellipsometers, thickness gauges and four point probes. The imported data can then be visualized or printed as line scans, contour plots, 2D or 3D plots or as a histogram.
Several kinds of operations can be applied to the wafer maps such as rotation, shifting of the grid in the X or Y direction, or mirroring the data along the X or Y axis. Global operations such as adding or subtracting a constant or taking the 1st or 2nd derivative can be carried out. A Sigma Filter allows for the elimination of sites that exceed a user-defined range (e.g. measurement errors). In case of missing or invalid sites, a transformation to a standard circular or Cartesian grid can be performed. Different grids can be merged into a single new one. It is also possible to compare different sets of data by adding, subtracting or dividing entire wafer maps. Maps can be exported to ASCII data files.
Typical applications include map generation for manually operated metrology tools and standardized visualization for different automatic metrology equipment (e.g. different types of four point probes in the same fab). WAFERMAP allows users to work off-line and to analyze and edit metrology data outside of the clean room. It's the perfect solution for paperless fabs.
WAFERMAP is designed for the semiconductor industry. The following list gives examples of a few of the applications for WAFERMAP:
- Enhancing the efficiency of equipment usage by off-line analysis of data. This prevents interference with current measurements, thus reducing cost-of-ownership
- Visualization and printing of measured data outside the clean room especially in "Paperless fabs"
- Standardized data visualization for different metrology tools (e.g. in order to compare different tools)
- Mapping of measured physical parameters using manual metrology equipment (e.g. manual ellipsometer)
- Simulation of different equipment features (e.g. wafer rotation in a deposition equipment or calculation of derivatives to get information on sources of inhomogeneity)
Click here to visit Boin GmbH and to download demo software versions
Improve your yield with powerful software
Their powerful software algorithms help process engineers to analyze test and metrology results and to perform statistical analysis. As a result, Boin's software solutions help improve the yield of IC manufacturers worldwide.
Click here to visit Boin GmbH and to download demo software versions
Abonnieren
Posts (Atom)